
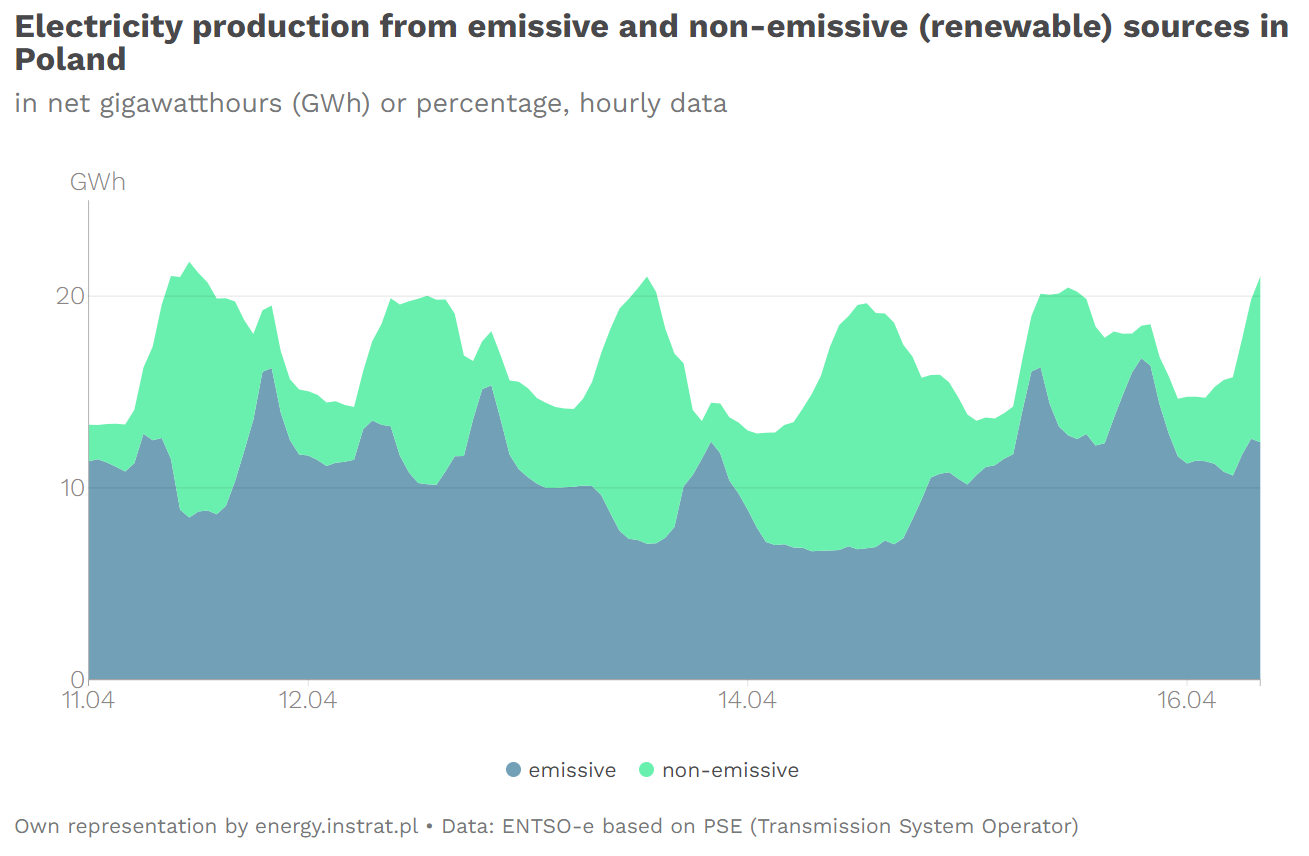
We are pleased to introduce the first new chart since the release of the new version of our platform. Electricity production, but grouped into two main categories: emissive vs non-emissive. Simple, but essential visualisation, which was already shown on the homepage in a very simplified version, now receives its own, separate space.
Although we also use the word “renewable” in this context, because it is widely recognizable, the actual title for the chart is emissive vs non-emissive sources. That is because we do not recognize biomass as a clean energy source, because it emits even more CO2 during combustion than lignite (112 vs 107 kgCO2/GJ, source: KOBiZE 2021). Meanwhile the EU still includes it in its understanding of “renewable” because of the concept of the lifecycle emissions, which supposedly balance each other.
Another wording that can be found is “emission-intensive” as an alternative to “emissive”. We treat them interchangeably.
The data is a sub-product of the dataset electricity production by ENTSO-e, so the aggregates and percentage view are similarly available. The data range is the same: 2015 – present. The chart is updated every hour as soon as the data is available from ENTSO-e.


